
Dow Jones Analysis (Daily Time Frame)
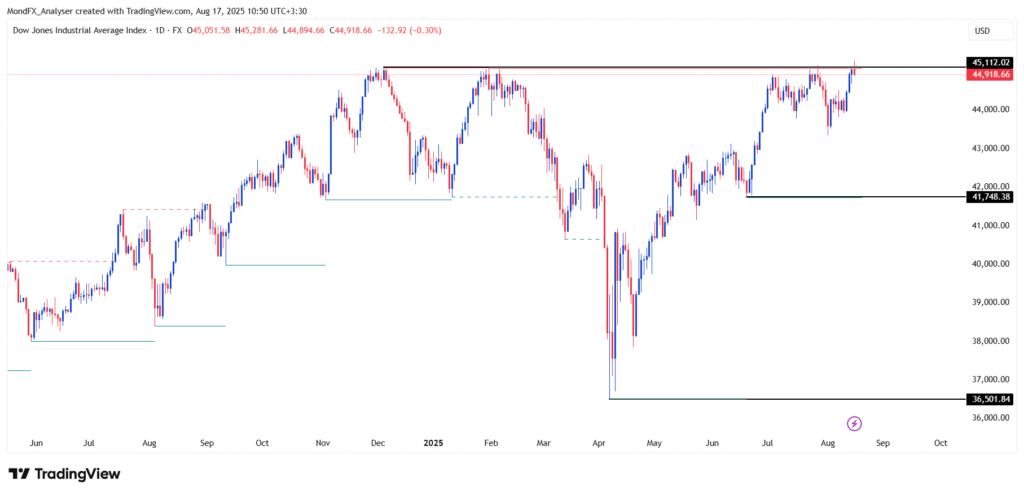
Main Scenario (with higher probability):
The price is consolidating to break above the key 45,100 level and has approached this resistance zone.
If the daily candle manages to break the 45,100 resistance, the bullish move could extend towards the 46,500 and then 47,200 areas.
The candlestick behavior and trading volume near the resistances confirm the presence of strong buyers and suggest the continuation of the bullish trend in the medium term.
Alternative Scenario (with lower probability):
If the price fails to break the 45,100 resistance and bearish candles form, a correction towards the 43,790 – 43,143 support zone is possible.
A break below the 43,143 area could activate a stronger corrective scenario and push the price towards lower supports such as 41,954 and 40,696.
Dow Jones Analysis (4-Hour Time Frame)
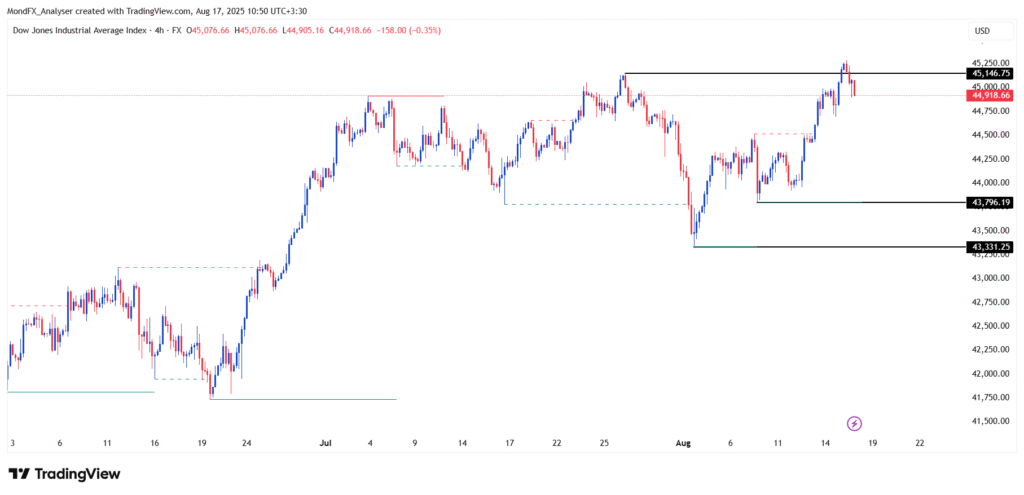
Main Scenario (with higher probability):
After reaching the 45,146 resistance, the price faced selling pressure. If it stabilizes again above this level, the bullish move could extend towards the 46,000 – 46,500 area.
Alternative Scenario (with lower probability):
Failure to break the 45,146 level could trigger a price correction towards the 43,796 and then 43,331 zones. A break below these levels would indicate sellers’ dominance and the beginning of a deeper corrective wave.
Dow Jones Analysis (15-Minute Time Frame)
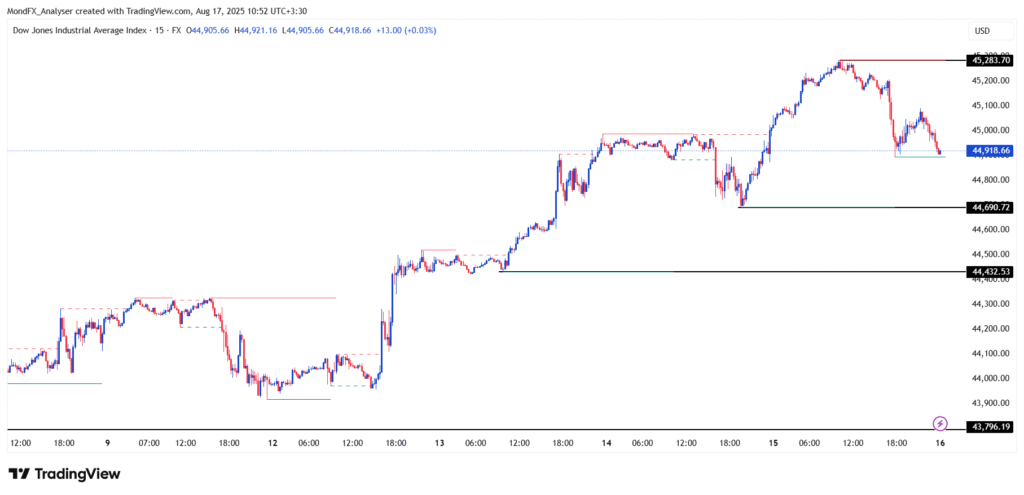
Main Scenario (with higher probability):
The price has stabilized around 44,900, and if it moves back above the 45,283 resistance, the short term bullish trend could continue towards 45,500.
Alternative Scenario (with lower probability):
If the 44,690 and 44,432 supports are broken, selling pressure could drive the price down towards the 43,796 area.