
Bitcoin Analysis (Daily Time Frame)
Main Scenario (with higher probability):
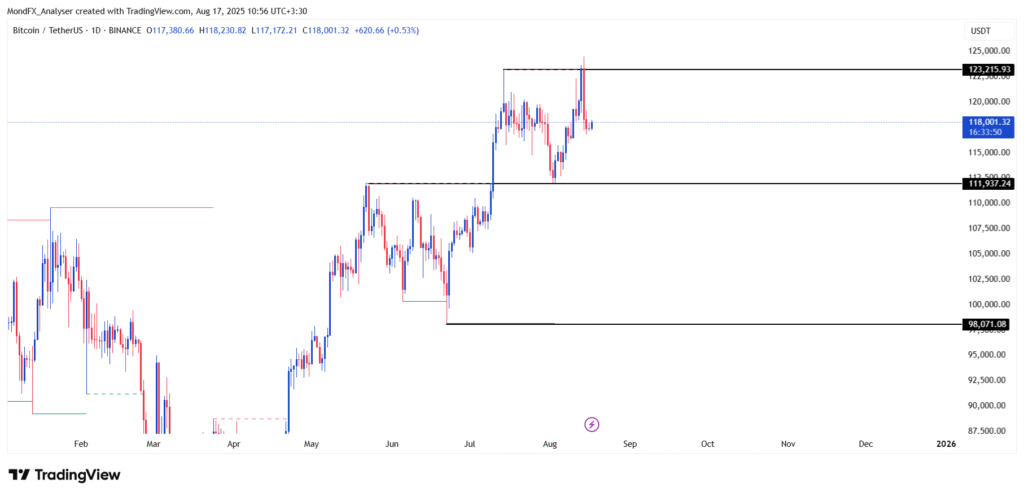
The price has reacted near the 123,200 resistance and is now consolidating around 118,000.
If the daily candle manages to stabilize again above 123,200, the bullish trend could extend towards the 124,500 – 128,000 targets.
The recent candlestick behavior indicates buyers’ presence at short term lows.
Alternative Scenario (with lower probability):
If the price fails to break the 123,200 resistance and selling pressure continues, a correction towards the 111,900 and then 98,000 zones is possible.
A break below the 98,000 support could seriously weaken the medium term bullish structure.
Bitcoin Analysis (4-Hour Time Frame)
Main Scenario (with higher probability):
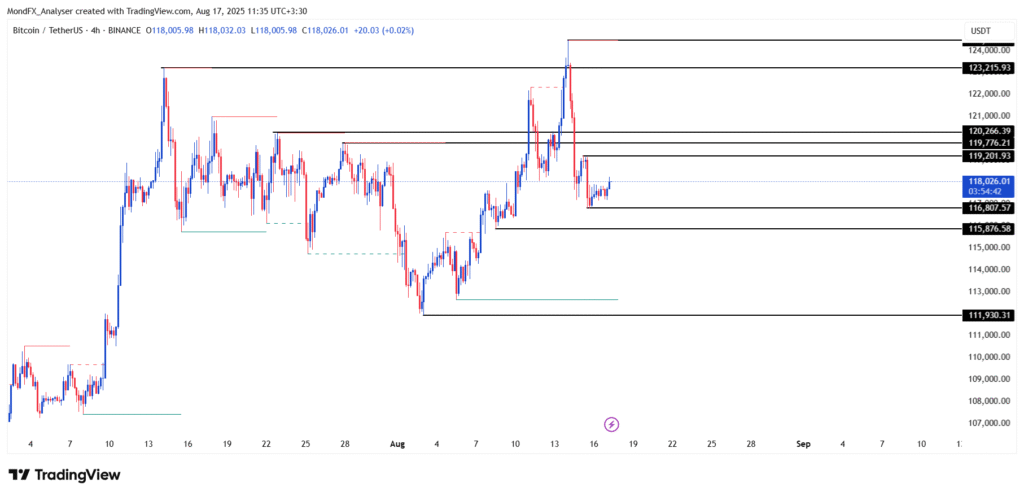
After dropping from the 123,200 resistance, the price is consolidating within the 116,800 – 119,700 range.
If 4 hour candles can stabilize above the 119,700 resistance, a bullish move towards 120,200 and then 123,200 will be likely.
Alternative Scenario (with lower probability):
If the 116,800 support is lost, selling pressure could push the price down towards 115,800 and then further to 111,900.
Bitcoin Analysis (15-Minute Time Frame)
Main Scenario (with higher probability):
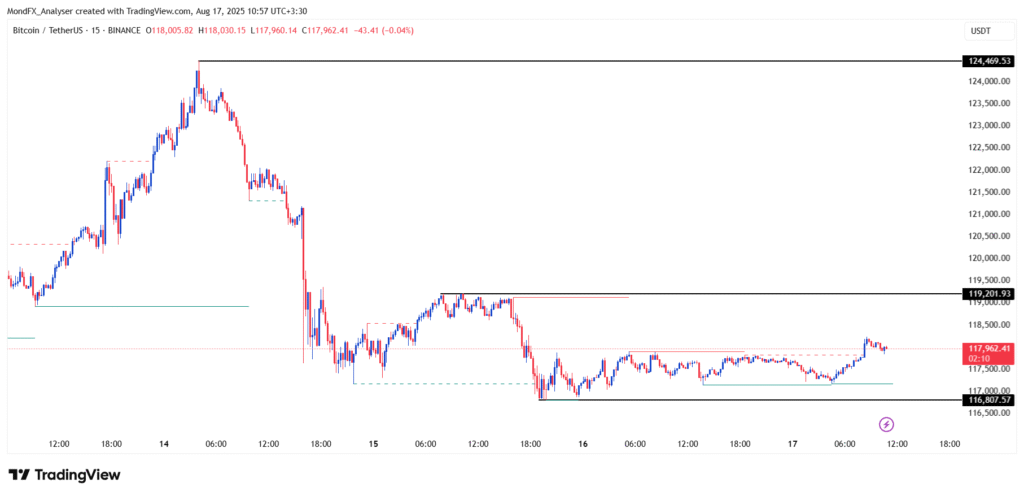
In the short term timeframe, the price is ranging between 116,800 – 119,200.
If the 119,200 resistance is broken, the short term bullish scenario will be activated, and a move towards 120,000 will be likely.
Alternative Scenario (with lower probability):
If the 116,800 support is broken, a short term decline towards 115,800 and even 114,500 would not be unexpected.