
Euro Analysis (Daily Time Frame)
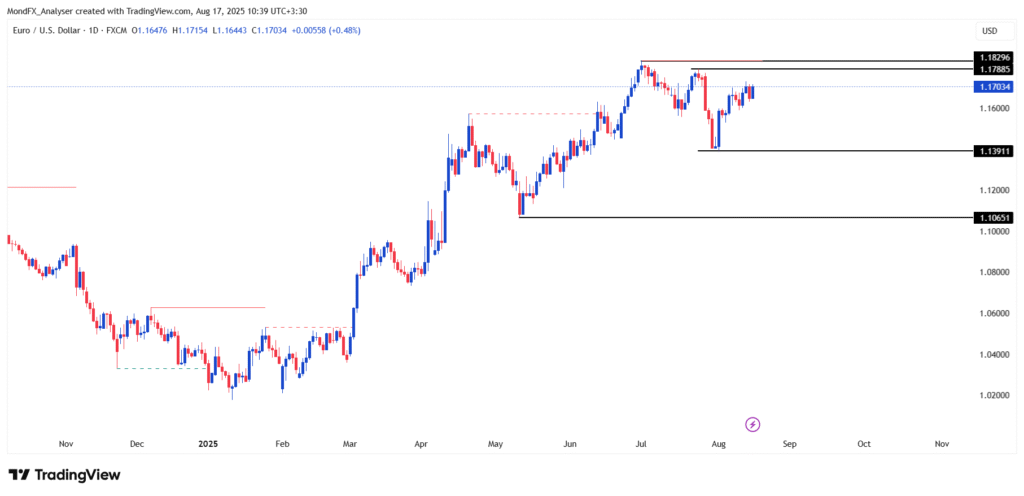
Last week, the EUR/USD chart experienced a ranging movement between 1.1593 and 1.1730.
Main Scenario (with higher probability):
- The price is moving towards breaking the resistance zone of 1.1788 to 1.1829.
- If the daily candle closes and stabilizes above the 1.1829 level, the probability of continuing the bullish trend towards the 1.1912 target will be very high.
- The current key support is located at the 1.1391 level, and as long as this level is maintained, the bullish structure will remain valid.
Alternative Scenario (with lower probability):
- If the price fails to stabilize above 1.1829, there is a possibility of a correction towards the supports at 1.1391 and then 1.1213.
- A break below the 1.1391 support can activate the medium term bearish scenario with a target of 1.1213.
Euro Analysis (4-Hour Time Frame)
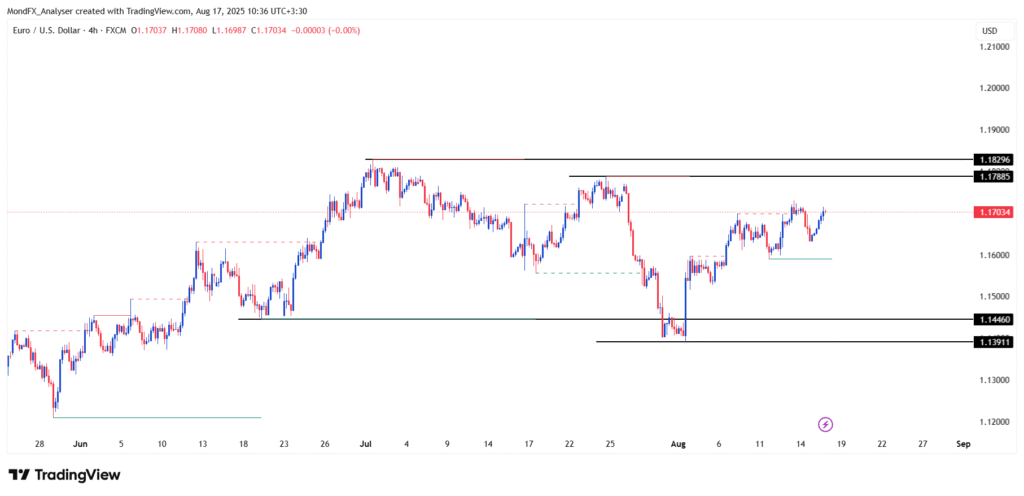
Main Scenario (with higher probability):
- After rising from the 1.1593 area, the price is moving towards the 1.1788 resistance, which is considered a sign of buyers’ strength.
- If the price holds above 1.1589, the bullish movement can continue towards the next resistance levels around 1.1829.
- The formation of consecutive bullish candles along with positive trading volume strengthens this scenario.
Alternative Scenario (with lower probability):
- If the price fails to stabilize above 1.1731 and bearish candles form, a correction towards the support zone at 1.1589 becomes possible.
- A break below the 1.1589 level will activate the corrective scenario, with targets such as 1.1446 becoming accessible.
Euro Analysis (15-Minute Time Frame)
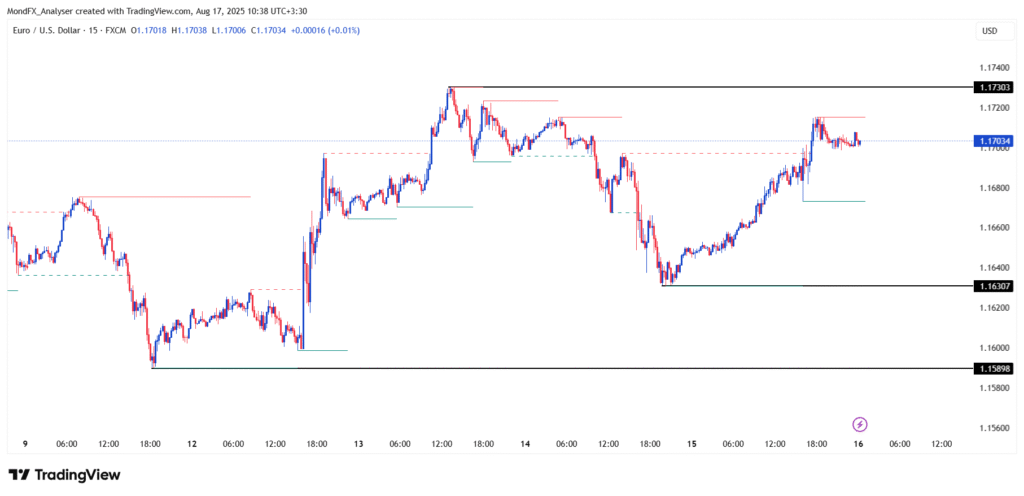
Main Scenario (with higher probability):
- The price is stabilizing above the 1.1697 resistance zone, and buying pressure is visible on the 15 minute timeframe.
- If the price manages to break above the 1.1730 level with strength, the next target could be 1.1770.
- Stability above 1.1730 along with the formation of consecutive bullish candles is a sign of maintaining positive momentum.
Alternative Scenario (with lower probability):
- If the price fails to break through the 1.1730 resistance and returns below 1.1673 with a bearish candle, a short term correction towards 1.1630 is possible.
- A break below the 1.1630 support zone could activate a fast bearish scenario with targets at 1.1598 or even 1.1589.