
Technical Analysis of Brent Oil (Daily Timeframe)
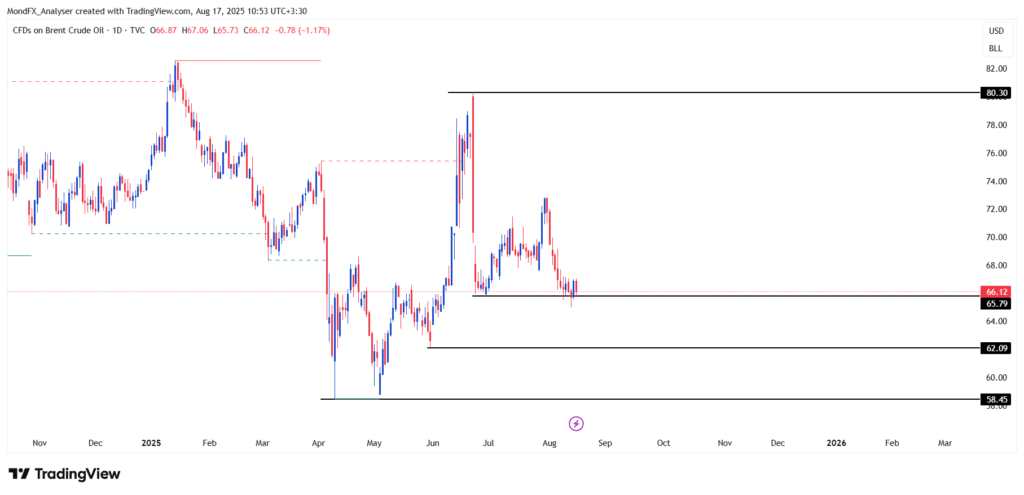
Main Scenario (with higher probability):
The price is trading around 66 USD, and the key support at 65.80 is being tested. If the price stabilizes below this level, the continuation of the bearish move towards 62.00 and even 58.40 USD is likely.
- The selling volume in recent candles indicates the dominance of supply over demand.
Alternative Scenario (with lower probability):
If the 65.80 USD support holds and the price rebounds, a bullish correction could extend towards the 72.80 USD resistance. Breaking this level would activate the bullish scenario, with the next targets around 80.30 USD.
Technical Analysis of Brent Oil (4H Timeframe)
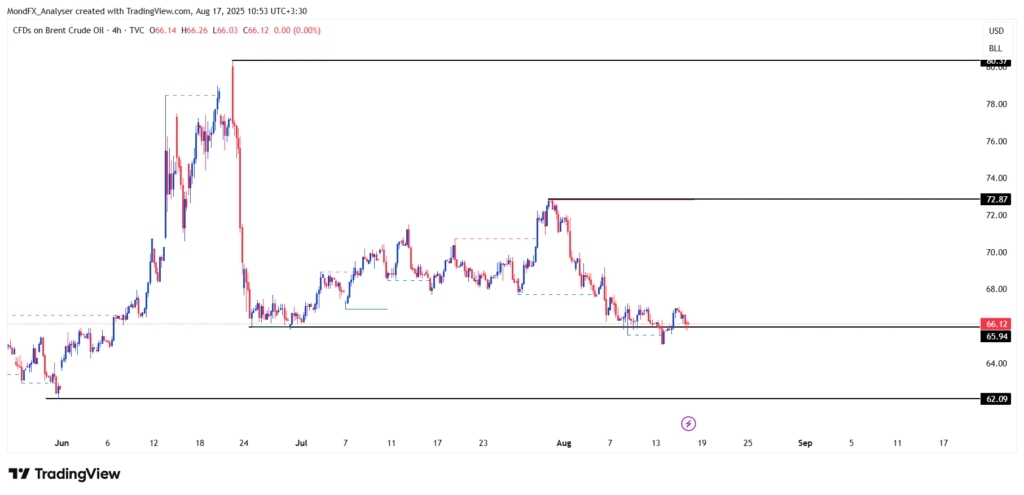
Main Scenario (with higher probability):
The price is fluctuating near the 65.90 USD support. A break and stabilization below this level could lead to a continuation of the decline towards 62.00 USD.
- The recent bearish pattern and consecutive bearish candles indicate sellers’ pressure.
Alternative Scenario (with lower probability):
If the 65.90 USD level holds, a bullish correction towards the 72.80 USD resistance may occur. A break above this zone would open the path for growth towards 80 USD.
Technical Analysis of Brent Oil (15-Minute Timeframe)
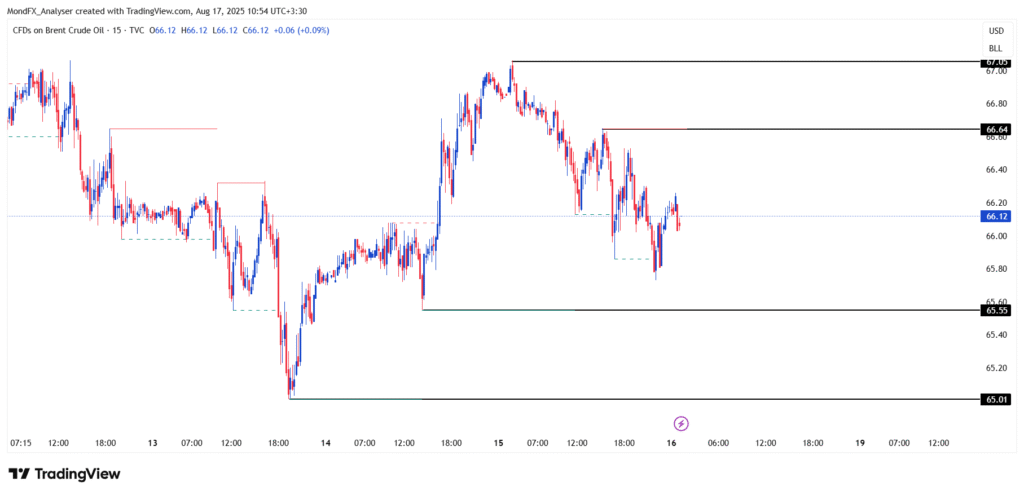
Main Scenario (with higher probability):
After several attempts to break the 66.60 USD resistance, the price has failed and is now reversing. Stabilization below 66.00 USD could trigger a decline towards the 65.55 and then 65.00 USD supports.
Alternative Scenario (with lower probability):
If the price manages to move back above 66.60 USD and stabilize, the short term corrective move may extend towards the 67.00 USD area.