The inverted cup pattern, also referred to in some sources as the upside down cup pattern, is one of the reversal patterns in technical analysis that typically appears at the end of an uptrend and signals a market phase change towards a downtrend. The structure of this pattern starts with a gradual upward movement, followed by the formation of a downward price curvature, creating a semi circular inverted shape. Subsequently, the market enters a consolidation or limited fluctuation phase, forming the handle of the pattern, and usually after the support of this area is broken, a new downtrend begins. The primary application of this pattern is to identify selling opportunities or exit points from long positions, especially when there is a high probability of a broad market reversal. Traders can use this structure to set low risk entry points and more precise price targets for their trades.
How Is the Structure of the Inverted Cup Pattern Formed?

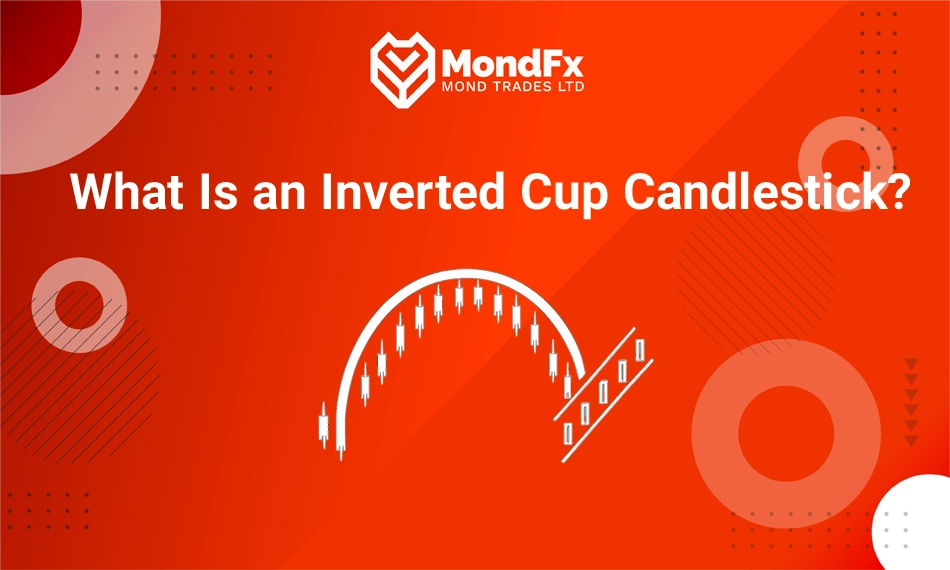
The structure of the inverted cup pattern forms in a way where the price initially moves in a mild uptrend and, upon reaching a certain area, gradually loses momentum and enters a curved downward path. This gradual price decline creates a curve resembling an inverted semi circle on the chart, forming the main body of the cup. After completing this curve, the price enters a resting or consolidation phase, usually appearing as a small, either neutral or slightly upward handle, and eventually, with the handle’s downward breakout, a signal for entering a bearish phase is issued. Relative symmetry on both sides of the cup, gradual volume decrease during the formation of the curve, and an increase in volume during the handle breakout are key features of this pattern’s structure, which are highly significant for technical analysts.
What Is the Difference Between the Inverted Cup Pattern and the Classic Cup Pattern?
The main difference between the inverted cup pattern and the classic cup pattern lies in the direction of the trend before formation and the expectations after the pattern’s completion. In the classic cup pattern, the structure forms after a price decline and is expected to lead to an uptrend upon the handle’s breakout, while in the inverted cup pattern, the initial trend is usually upward, and the formation of the reversed curve indicates a weakening of buyers and the probable beginning of a bearish phase. Visually, the classic cup resembles a U shape or a rounded bowl, whereas the inverted cup has a downward arch representing the gradual increase in selling pressure in the market. Also, in the inverted cup, resistance forms at the top of the curve, and the downward breakout is significant, while in the classic cup, the focus is on breaking the resistance upward.
Market Psychology Analysis in the Inverted Cup Pattern
The market psychology analysis in the inverted cup pattern shows that after a period of optimism and price increase, the market gradually faces distrust and a decrease in demand, and this shift in sentiment appears in the form of a downward curve. In the early stages, buyers are still active, but as the price approaches a peak and the market fails to continue its upward movement, doubts increase and sellers gradually take control. The formation of the inverted cup indicates a progressive weakening of buyers’ strength, which steadily and without excitement gives way to selling pressure. In the handle section, these doubts reach their peak as the market tests its ability to overcome resistance again, but ultimately, with the breakdown of this phase, selling pressure dominates the market. This pattern reflects a gradual but structural shift in the mass psychology of the market from hope to decline.
Conditions for the Formation of the Inverted Cup Pattern on the Price Chart
For the inverted cup pattern to properly form on the price chart and be considered a valid reversal signal, several technical conditions must be met. These conditions are presented below individually with analytical explanations:
Existence of a Preceding Uptrend
The inverted cup pattern always forms after an upward movement in the market because its nature is that of a reversal and indicates the weakening of buyers’ strength following a wave of growth. If such a trend does not exist prior to the pattern, the formation of the inverted cup structure would be meaningless and could merely represent random price fluctuation.
Gradual, Arc Like Downward Movement in the Cup Structure
One of the key conditions for identifying the inverted cup is the presence of a gradual downward curvature in the price structure that follows a smooth and orderly path instead of a sharp and sudden drop. This curve indicates a gradual shift in the balance of power between buyers and sellers and typically takes time to form, especially on higher time frames.
Price Stabilization or Limited Fluctuation at the End of the Cup as the Handle
After completing the cup curve, the price enters a phase of stability or light correction, which appears in the form of a narrow channel or limited sideways movements. This area, forming the handle of the pattern, usually reflects the caution of the remaining buyers and the readiness of the sellers for final market entry.
Breakdown of the Handle’s Support Area with High Volume and a Strong Candle
The most important condition for confirming the inverted cup pattern is the breakdown of the lower support area of the handle with significant trading volume and a strong candle indicating the continuation of the downward trend. If this breakdown occurs with low volume or a quick price reversal, it cannot be considered a definitive signal, and there is a risk of market traps or false breakouts.
Relative Symmetry of Both Sides of the Cup in Price Movement
For the inverted cup structure to be visually and analytically valid, it is preferable that its downward curve has relative symmetry on both sides. If one side of the cup is much steeper or slower than the other, the structure of market strength becomes inconsistent, and the likelihood of misinterpretation increases, especially when short term fluctuations are high.
How to Identify the Inverted Cup Pattern on the Chart
To accurately identify the inverted cup pattern on the price chart, a trader must pay attention to several specific characteristics in price behavior and structure. These features gradually appear within a particular framework, each explained carefully and analytically below:
Identifying a Symmetrical Downward Curve at the End of an Uptrend
The first sign to watch for is the emergence of a gradual downward curve after the end of an upward wave. This curve should not be sharp or aggressive but should appear symmetrical and orderly to indicate the gradual weakening of buying power and the progressive increase in selling pressure. If such a curved structure appears on the chart, it can be considered an initial signal for the formation of an inverted cup.
Presence of a Clear Resistance at the Top of the Cup and Failure to Break Through It
In most cases, the price encounters a resistance level before starting the downward curve, which is considered the starting point of the cup. The inability to break through this resistance and the gradual reversal from it, especially after several consecutive attempts, indicates the strength of the sellers and the market’s preparation for a corrective or reversal move. This level is usually recognized as the upper rim of the cup.
Identifying the Handle Area at the End of the Cup with Limited Fluctuations and Neutral or Slightly Upward Bias
After the cup formation, the price typically enters a phase of consolidation or temporary correction, visible as a narrow channel, triangle, or sideways movement. This area, known as the handle, may reflect the caution of remaining buyers or the market’s final attempt to maintain higher levels. The handle should usually be accompanied by lower volume compared to the previous phases.
Observing the Break of the Handle’s Lower Support Area Along with a Strong Bearish Candle
The entry point into a trade or the final confirmation of the pattern occurs when the price breaks below the lowest point of the handle and moves downward with a strong bearish candle. This breakout should generally be accompanied by increased trading volume, indicating the participation of major sellers in the market. At this moment, it can be said that the inverted cup pattern is fully activated, and the likelihood of a continued downward movement has increased.
Validating the Inverted Cup Pattern with Trading Volume
To validate the inverted cup pattern, trading volume is one of the key tools that can confirm or refute the strength and accuracy of this pattern on the chart. Below are several important criteria for assessing the validity of this pattern based on trading volume, each playing an independent role in professional analysis:
Decreasing Volume During Cup Formation
When the inverted cup structure is forming, a gradual decrease in trading volume is usually observed, indicating a fading enthusiasm among buyers and a gradual withdrawal of capital from the market. This decline in volume during the gentle price drop signals weakening buying pressure and increases the likelihood of a trend reversal.
Stable or Declining Volume During the Handle Phase
In the handle part of the inverted cup pattern, trading volume is often stable or lower than normal, as the market is in a state of hesitation or indecision during this phase. This volume behavior usually indicates that professional investors are evaluating conditions for serious entry into short positions and have not yet taken action.
Noticeable Increase in Volume Upon Handle Breakdown
The most important sign of confirmation for the inverted cup pattern is a sudden and distinct rise in trading volume precisely at the moment when the price breaks through the lower support of the handle. This volume spike indicates the active entry of major sellers into the market, and if accompanied by a strong bearish candle, the probability of a continued downtrend will significantly increase.
No Price Reversal After Breakdown Alongside Sustained High Volume
After the handle’s support is broken, if trading volume remains elevated and the price does not return to the broken area, it further validates the pattern. This scenario shows that not only was the breakout genuine, but buyers were also unable to mount a serious reaction to reclaim the price level, serving as strong confirmation of the beginning of a downward trend.
The Role of Timeframe in Analyzing the Inverted Cup Pattern
In analyzing the inverted cup pattern, choosing the appropriate timeframe plays a very important role in the accuracy of identification and the validity of the resulting signal. The higher the timeframe in which this pattern forms, the greater its reliability and predictive strength. Below, the role of timeframe is examined from several perspectives:
Higher Timeframes and Increased Analysis Reliability
When the inverted cup pattern forms on daily, weekly, or even monthly charts, this reversal signal usually carries much more credibility compared to lower time frames. In longer timeframes, price movements are the result of decisions made by larger market participants, and short term fluctuations have less impact; therefore, the strength and sustainability of trends after the pattern’s breakout are greater.
Mid Term Timeframes and Opportunities for Swing Trading
On time frames such as the four hour or daily charts, the inverted cup pattern is highly practical for mid term or swing trading strategies. In this case, the trader has the opportunity to observe the gradual formation of the pattern and its handle, define optimal entry points, logical stop losses, and realistic targets for sell trades, and capitalize on the market’s wave-like movements.
Lower Timeframes and the Challenge of Market Traps
On lower time frames like fifteen minute or one hour charts, the inverted cup pattern may appear frequently but is not always reliable. High volatility, real time news events, and shallow liquidity during these periods increase the likelihood of false breakouts or rapid trend reversals. Therefore, on lower time frames, the pattern should be combined with additional confirming tools such as trading volume and candlestick analysis.
Aligning Timeframe with Personal Trading Style
An important point in analyzing this pattern is that the selected timeframe must align with the trader’s personal trading style and objectives. For a day trader, observing an inverted cup pattern on one hour to four hour time frames is sufficient, while a long term investor would place more trust in patterns formed on daily or weekly charts. Consistency between the analysis timeframe and the personal strategy is a necessary condition for the successful application of this pattern.
How to Enter a Short Trade Using the Inverted Cup Pattern
Entering a short trade using the inverted cup pattern requires following several analytical and managerial steps so that the trader can utilize this pattern as a reliable signal. Below, the steps for entering a short position based on the technical structure of this pattern are explained:
Waiting for the Complete Formation of the Cup and Handle
Before taking any action to enter the trade, it must be ensured that the inverted cup pattern has fully formed and that the handle has appeared as a limited consolidation area at the end of the price curve. Entering prematurely before the pattern is complete can lead to misanalysis and positioning in the opposite direction of the main market movement. Emphasis on the correct visual identification of the pattern is the starting point of a successful decision.
Identifying the Breakout Point and Confirming It with Trading Volume
The point of entry for the short trade precisely occurs when the price breaks below the support level at the bottom of the handle and a strong bearish candlestick appears with high volume. If this breakout is accompanied by sufficient momentum and market willingness to continue the downward trend, it indicates the strength of sellers and the beginning of a new bearish movement. Confirming the breakout with volume significantly increases the probability of a successful trade.
Placing the Stop Loss Above the Handle or the Cup Rim
To protect the capital against false breakouts or sudden reversals, it is essential to determine an appropriate stop loss placement. The best place to set the stop loss is slightly above the top of the handle or the rim of the inverted cup, because a price move beyond this area would invalidate the pattern. Risk management based on the price structure of the pattern is a key principle of professional trade entry.
Setting a Price Target Based on the Depth of the Cup
To calculate the price target in a short trade, usually the distance between the top and the bottom of the cup is used as the benchmark, and this distance is projected downward after the handle breakout as the bearish target. This calculation helps the trader to weigh the potential profit of the trade against the risk and to avoid entering positions with an unfavorable risk to reward ratio. Choosing a realistic target is the foundation of long term success in short trading.
Setting Stop Loss and Target in the Inverted Cup Pattern
In the inverted cup pattern, accurately determining the stop loss and price target is crucial, as this pattern can trigger a powerful downward movement when the support area is broken. Traders who enter the market without setting these levels are exposed to uncontrollable risks. Below is an explanation of how to logically and technically determine these two levels:
Setting the Stop Loss Above the Handle or Cup Rim
To determine the stop loss placement, the best option is usually slightly above the top of the handle in the inverted cup structure. If the price reverses after the downward breakout and is able to break this level again, logically, the pattern should be considered invalid. In cases where the handle is very short or compressed, the stop loss can be placed just above the peak of the cup to act more safely against false movements.
Setting the Price Target by Measuring the Depth of the Cup
To calculate the price target, the vertical distance between the highest point of the cup and the lowest part is measured first. This distance is considered a technical benchmark and is projected downward from the handle breakout point, with the same value used as the bearish target. This method practically defines the expected movement and can be optimized by combining it with historical support levels or Fibonacci areas.
Balance Between Stop Loss and Target for Risk Management
Simply determining the stop loss and target is not enough; the ratio between these two should be logical and profitable. In most strategies based on the inverted cup pattern, a proper risk to reward ratio of at least 1:2 is considered. If the ratio between these two levels is less than the standard threshold, entering the trade is not justified, even if the pattern looks ideal, as capital management plays an equally important role in long term success alongside technical analysis.
The Inverted Cup Pattern in Forex, Stock Markets, and Cryptocurrencies
Although the inverted cup pattern can be seen in all financial markets structurally, depending on the unique characteristics of each market, it can exhibit different behaviors. Understanding the differences in the application of this pattern in Forex, stock markets, and cryptocurrencies helps traders develop a more accurate analysis and effective strategy. Below is an analysis of the role of this pattern in the three main markets:
Inverted Cup Pattern in Forex
In the Forex market, which is characterized by high liquidity and trend based behavior in various timeframes, the inverted cup pattern typically appears near price peaks or after high risk economic news releases. This pattern can be a sign of weakness in the continuation of an upward trend in currency pairs, especially when formed in higher time frames such as daily or four hour charts. In Forex, the breakout of the handle with high volume is usually accompanied by significant volatility, providing a good opportunity to enter sell positions in the opposite direction of the previous trend.
Inverted Cup Pattern in Stock Markets
In the stock market, the inverted cup pattern often appears at the end of long term uptrends and can serve as an important warning for the beginning of a correction or downturn phase. Traders with buy positions in a growing stock can use this pattern to exit smartly before the decline begins. Due to the stock market’s susceptibility to public sentiment and fundamental news, combining this pattern with market psychology and volume analysis plays a significant role in the accuracy of the analysis.
Inverted Cup Pattern in Cryptocurrency Markets
The cryptocurrency market, due to its high volatility, displays the inverted cup pattern more frequently than other markets, even in shorter time frames. This pattern often forms quickly, and its breakout is accompanied by strong movements and deep corrections. Crypto traders who operate based on price action or classic patterns use this structure to identify exit points before heavy corrections begin, as well as to enter short positions in futures markets. In this market, risk management, alongside pattern analysis, becomes even more critical.
Common Mistakes in Analyzing the Inverted Cup Pattern

In analyzing the inverted cup pattern, many traders make mistakes due to unfamiliarity with the pattern’s structure and the behavior of the market, which can lead to incorrect trading decisions and significant losses. Identifying these mistakes and understanding their causes plays a crucial role in improving the accuracy of technical analysis. Below are the most common mistakes in analyzing this pattern:
Entering Too Early Before the Pattern is Complete
One of the common mistakes is entering a sell position before the handle is fully formed or before confirming the break of the lower support level. Many analysts assume that a downtrend has begun simply by seeing the downward curve in price, whereas without a definitive breakout of the handle, no confirmed signal exists, and the price could reverse upwards again.
Ignoring Volume at the Breakout
Many traders only consider the price when assessing the support break at the end of the handle, without paying attention to the volume behavior. If this breakout occurs with low volume and without significant participation from major traders, the likelihood of a price reversal or false breakout increases. Ignoring volume analysis can produce misleading signals.
Misunderstanding Timeframe and Its Application
Sometimes analysts treat the inverted cup pattern as a definitive signal on very short term charts without considering the time frame used. In lower time frames, market fluctuations can produce patterns resembling the inverted cup that do not have real validity. The validity of this pattern is only ensured when it aligns with the appropriate time frame and is confirmed by other tools.
Mistaking the Cup and Handle Structure
Sometimes analysts mistake a simple price correction for an inverted cup pattern. If the cup lacks relative symmetry and a smooth curvature or if the handle does not match well known patterns like triangles, channels, or flags, it should not be considered as an inverted cup. Analyzing without a clear visual understanding of the geometric structure of the pattern can lead to misinterpretation in decision making.
Examining a Real Example of the Inverted Cup Pattern on a Chart
Example on the Bitcoin Chart in the Daily Timeframe
In a significant price moment for Bitcoin in 2022, after a period of gradual growth up to the $25,000 range, the price gradually entered a downward curve, forming a clear inverted cup structure over several weeks. The behavior of the candlesticks during this phase indicated market fatigue and a decrease in buying momentum, with every attempt at a rebound met with selling pressure.
Formation of the Handle in a Narrow Ascending Channel
After the downward curve was fully formed, the price entered a consolidation phase near the $24,500 level, creating a weak ascending channel. This indicated the market’s hesitation about continuing the trend. This mild correction formed the inverted cup’s handle, and given the low trading volume, the likelihood of a continued upward movement was very limited.
Break of the Handle and the Start of a Strong Downtrend
Subsequently, the handle’s support level broke at around $24,000, and a strong bearish candle appeared with volume above the average, signaling the confirmation of the inverted cup pattern. After this break, Bitcoin quickly entered a phase of decline, dropping to the $20,000 level over a few days, demonstrating how effective this pattern can be for identifying sell positions. This example once again highlights the importance of patience in waiting for the full formation of the pattern and its confirmation with volume behavior.
Is the Inverted Cup Pattern Always Reliable?
The inverted cup pattern, like many classic technical analysis patterns, while it can provide a precise reversal signal under certain conditions, cannot be considered 100% reliable at all times. The validity of this pattern depends on multiple factors, including the timeframe of analysis, market psychology, trading volume, and its placement within the overall trend structure. In many cases, patterns with similar appearances may behave differently due to the lack of necessary confirmations or the presence of impactful fundamental news, which can lead to false breakouts. Therefore, using the inverted cup pattern should be done in conjunction with other analytical tools, such as volume confirmation, historical support and resistance levels, and complementary indicators, to increase the likelihood of successful analysis.